

Hold time is one of the easiest settings to get wrong. Too short, and material flows back out of the cavity before the gate seals, which shows up as low part weight, sinks, voids, or dimensions that drift. Too long, and you are adding cycle time that does nothing for the part. The gate freeze study, also called the gate seal study, finds the point where extra hold time stops adding weight to the part.
What “gate freeze” means
During pack and hold, the screw keeps pushing material into the cavity to make up for shrinkage as the plastic cools. That only works while the gate is still open. Once the material in the gate solidifies, the cavity is sealed off. Holding pressure after that point cannot add material to the part.
Because part weight is a direct measure of how much material got into the cavity, weighing parts at increasing hold times shows you when the gate sealed. Weight rises with hold time, then levels off. The point where it levels off is the gate freeze time.
Before you start
The study is only as good as the process underneath it. Before running it:
- Fill speed should be set, ideally from a viscosity curve.
- Transfer position should be set so the part is close to full at the end of fill.
- Hold pressure should be at a reasonable working value. Gate freeze time can shift with hold pressure and with mold and melt temperature, so run the study at the conditions you intend to use.
- Cooling time should be long enough that changing hold time does not change the total time the part spends in the mold in a way that affects weight. Many processors keep the overall cycle constant by reducing cooling time as hold time goes up.
- Use a scale with enough resolution for the part. Small parts may need 0.001 g resolution to see the plateau clearly.
How to run it
- Start at a short hold time, often near zero or at the shortest practical setting.
- Increase hold time in fixed steps, for example 0.5 s or 1 s, depending on part size and gate size.
- At each step, let the process settle, then collect several parts.
- Weigh the parts. On multi-cavity tools, weigh a consistent set: either the full shot or the same cavity each time. Weigh parts without the runner when the runner would mask what is happening in the cavity.
- Average the weights at each hold time and plot average weight against hold time.
How to read the result
The curve should rise and then flatten. To call the plateau, compare each step to the one before it. When the change in average weight falls under a small threshold, the gate has sealed. A tight threshold such as 0.1 percent change is a common default, though your shop may use a different value.
Most processors then add a margin to the freeze time, commonly about one second, so normal variation does not leave the process right at the edge of an unsealed gate.
Things to watch:
- No clear plateau. If weight keeps climbing, the gate may not be freezing at these conditions. That can point to a hot-runner or valve-gate tool (where the gate is closed mechanically), a gate that is large relative to the wall, or a hold pressure or melt temperature that is keeping the gate open. Valve-gated tools need a different approach, because the valve, not the plastic, decides when the cavity seals.
- Weight falls at long hold times. This can happen if cooling time was reduced too far as hold time went up, or if something else in the process changed during the run.
- Scatter within a step is larger than the change between steps. The scale resolution may be too coarse, or the process was not settled.
Illustrative example
The numbers below are the IMPD app’s built-in sample data: generated test data, not from any real customer or production job.
Four cavities, plateau threshold 0.1 percent, margin 1 s. Weights are the average of the four cavities at each hold time.
| Hold time (s) | Average part weight (g) | Change from previous |
|---|---|---|
| 1 | 38.10 | — |
| 2 | 39.90 | +4.72 % |
| 3 | 40.44 | +1.35 % |
| 4 | 40.47 | +0.07 % |
| 5 | 40.49 | +0.05 % |
| 6 | 40.50 | +0.02 % |
| 7 | 40.50 | +0.00 % |
| 8 | 40.50 | +0.00 % |
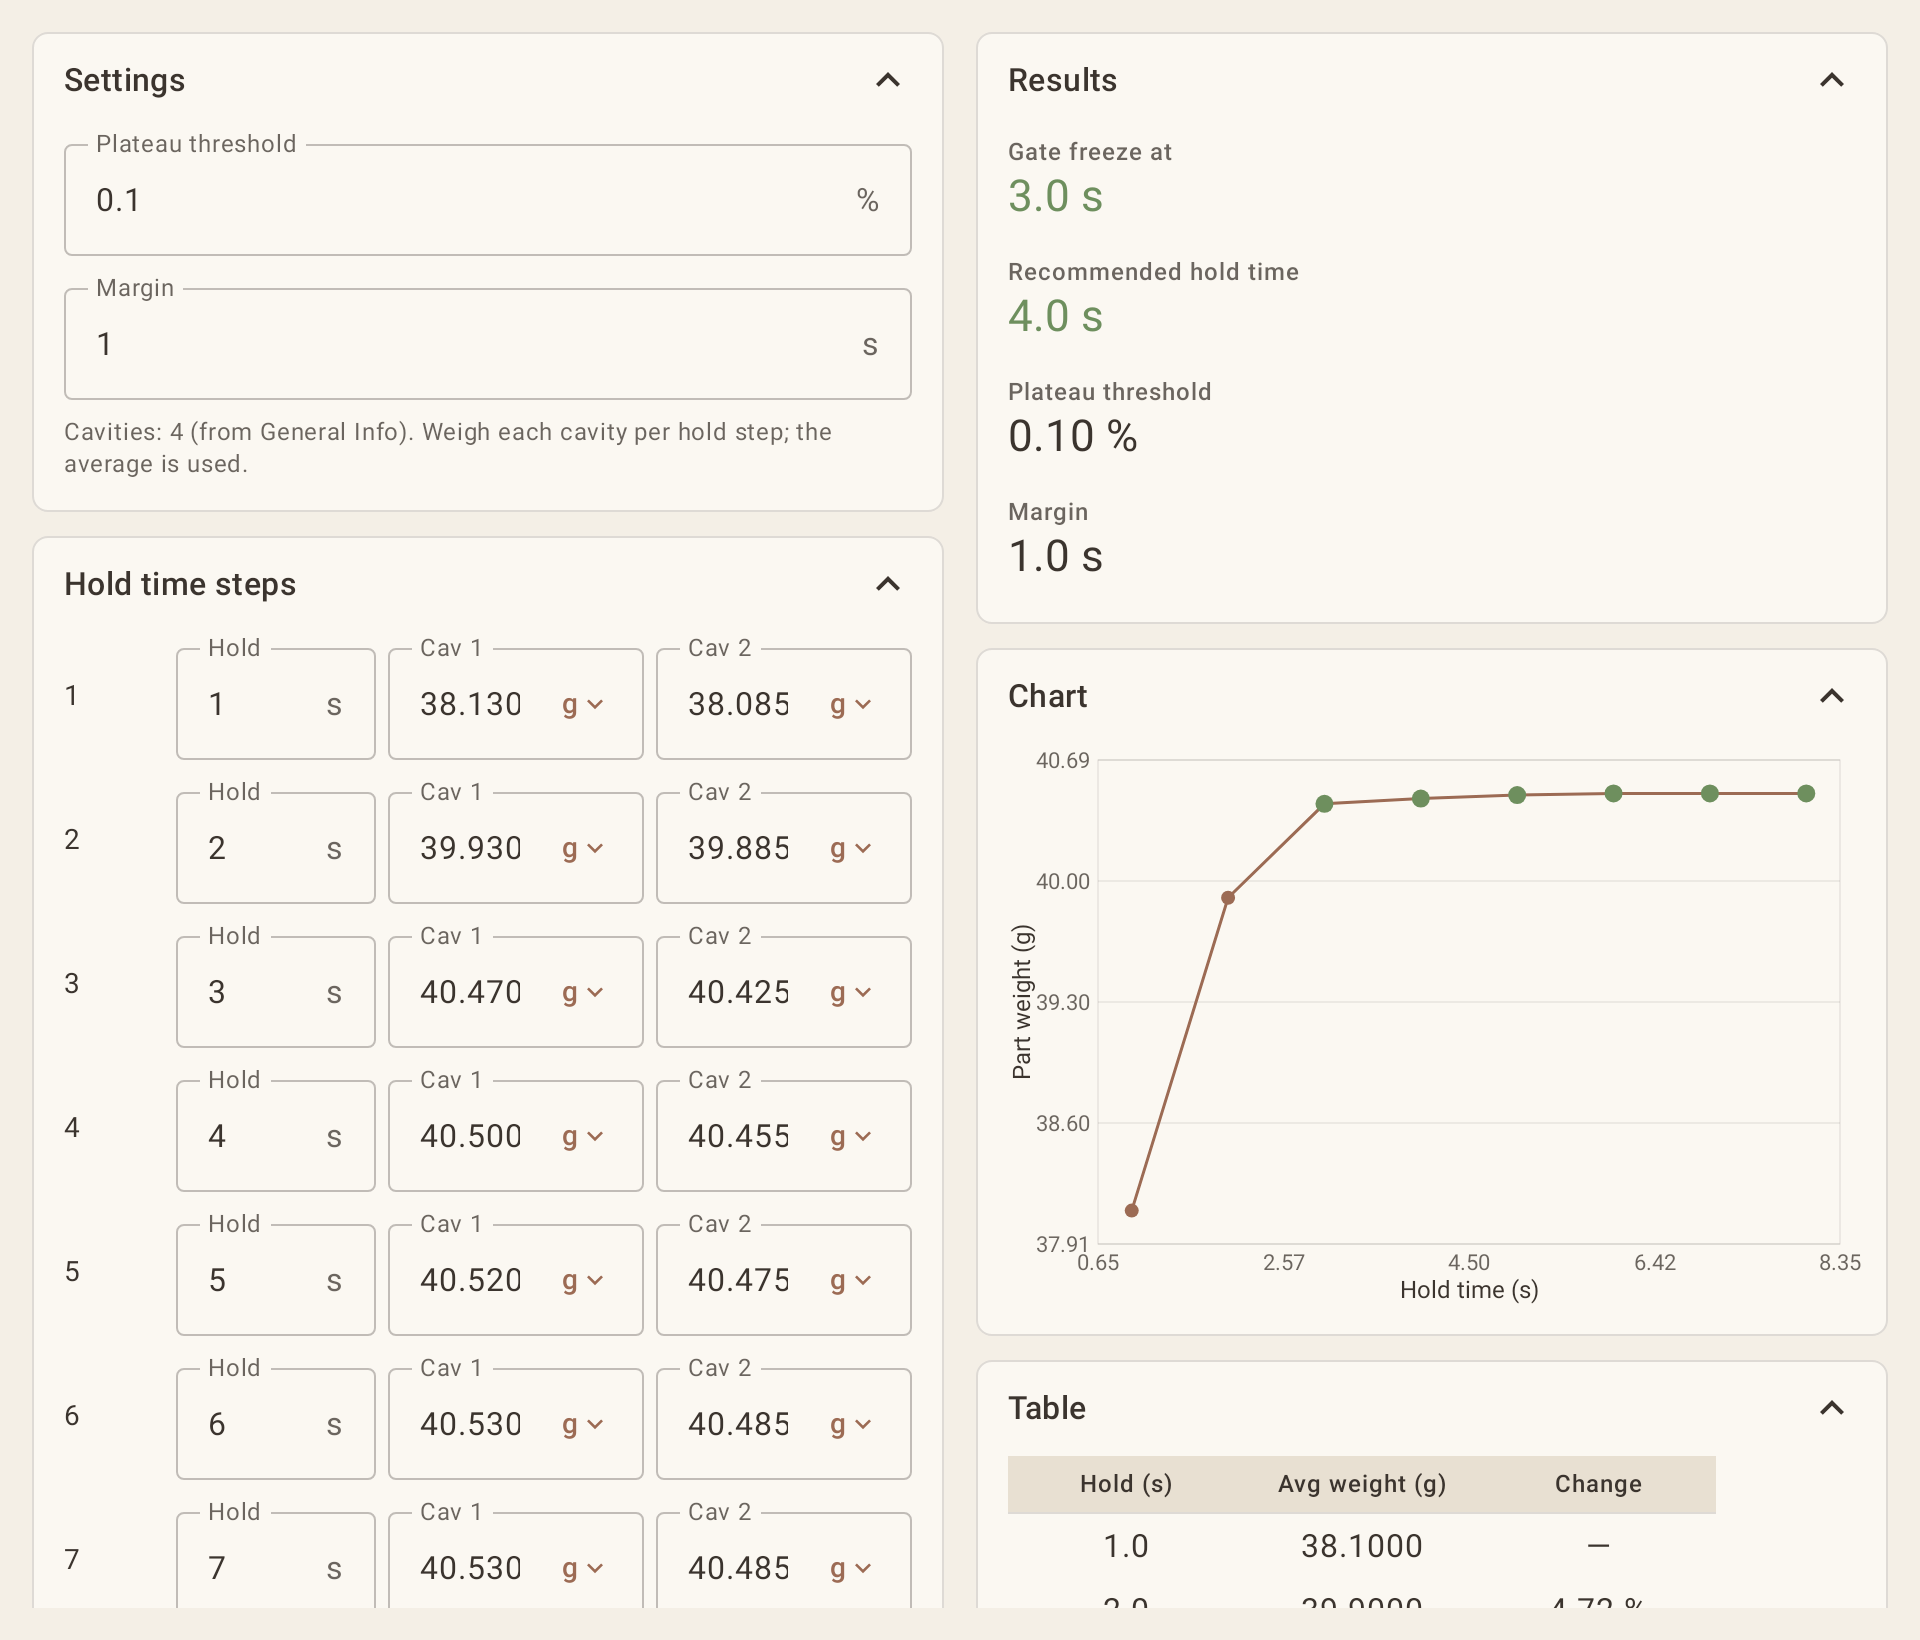
In this sample data, weight climbs steeply up to 3 s, and the change from 3 s to 4 s is only 0.07 percent, under the 0.1 percent threshold. The gate has sealed at 3.0 s. With a one-second margin, IMPD recommends a hold time of 4.0 s, and the processor would confirm dimensions and appearance at that setting.
Why it is worth the time
A documented gate freeze study turns hold time into a setting you can defend. When dimensions drift later, you can check whether hold time is still above the measured freeze point rather than guessing. When a mold moves to another press, you have a reference for what to re-check. And when cycle time is under pressure, you know which seconds of hold time are doing real work.
How IMPD supports this
IMPD’s Gate Freeze study averages part weight at each hold time, finds the plateau (under 0.1 percent change by default), and recommends hold time as freeze time plus one second. Part weights can be entered by hand or read from an RS-232 scale over a USB-serial adapter. The table, chart, and recommendation go into the job’s PDF report. IMPD records data and runs calculations to support engineering decisions; it does not control the machine.
IMPD is coming soon to Google Play. Sign up on the home page to get one email at launch, plus a free month on a yearly subscription.
Leave a Reply