

The viscosity curve, often called the rheology study or in-mold rheology study, is usually the first study in a scientific molding process. It answers a simple question: at what injection speed does the melt’s apparent viscosity stop changing much? Set fill speed in that range and small swings in material lot, temperature, or machine response have less effect on how the cavity fills.
This article walks through why the curve matters, how to run it, and how to read the result.
Why viscosity changes with speed
Most thermoplastics are shear-thinning. As the melt moves faster through the nozzle, runner, gate, and cavity, the shear rate goes up and the apparent viscosity goes down. At low speeds that drop is steep: a small change in speed produces a large change in viscosity, and so a large change in how the part fills. At higher speeds the curve flattens. Viscosity still falls, but each step in speed changes it less.
That flatter region is where you want to run. If the viscosity is stable, then the normal variation you cannot fully control has a smaller effect on fill.
What you measure
The study uses data the press already gives you. For each injection speed you record:
- Fill time, the time to fill to the transfer position.
- Peak injection pressure at transfer (hydraulic pressure on most presses, or plastic pressure if the machine reports it).
- Intensification ratio of the machine, so hydraulic pressure can be converted to plastic pressure.
From those, the common shop-floor calculation is:
- Relative viscosity = peak plastic pressure × fill time
- Relative shear rate = 1 ÷ fill time
These are relative numbers. They are not the absolute viscosity a lab rheometer would report, and they do not need to be. The study compares the same tool, material, and press against itself across speeds.
How to run it
- Start with a short-shot, fill-only setup. Turn hold pressure and hold time off or to a minimum so you are looking at fill alone. Set transfer so the part is roughly 95 to 98 percent full at the fastest speed.
- Make sure the press is not pressure-limited. Raise the injection pressure limit high enough that the machine can actually reach the speed you set. If the press runs out of pressure, the speed you entered is not the speed you got, and the data point is misleading.
- Pick a spread of speeds. Cover the usable range of the machine from slow to fast. Six to eight steps is typical.
- Run each speed and record fill time and peak pressure. Let the process settle for a few shots at each setting before recording.
- Calculate and plot relative viscosity against relative shear rate (or against injection speed).
How to read the curve
Look at the percent change in relative viscosity from one step to the next. Where that change drops below a chosen threshold, the curve has flattened. A common working threshold is under 10 percent change between steps, but use what your shop has agreed on.
A few practical points:
- Pick a speed inside the flat region, not at its very edge. That leaves margin on both sides.
- Check the parts, not just the curve. A fast speed may sit on the flat part of the curve and still cause jetting, burning, flash, or gate blush. The curve tells you where viscosity is stable. The parts tell you which of those speeds is acceptable.
- Watch for the pressure limit. If peak pressure at the fast end approaches the machine maximum, those points are suspect. Leave room for the pack and hold phase too.
- A noisy curve usually means the process was not stable at one or more points, or the speed actually delivered was different from the setpoint. That is a good reason to run a linearity check on the press.
Illustrative example
The numbers below are the IMPD app’s built-in sample data: generated test data, not from any real customer or production job.
Nine injection speeds from 0.50 to 4.50 in/s:
| Speed (in/s) | Fill time (s) | Peak pressure (psi) | Shear rate (1/s) | Relative viscosity (psi·s) | Change from previous |
|---|---|---|---|---|---|
| 0.50 | 6.303 | 320 | 0.16 | 24,204 | — |
| 1.00 | 3.152 | 510 | 0.32 | 19,290 | −20.3 % |
| 1.50 | 2.101 | 640 | 0.48 | 16,136 | −16.4 % |
| 2.00 | 1.576 | 740 | 0.63 | 13,995 | −13.3 % |
| 2.50 | 1.261 | 820 | 0.79 | 12,408 | −11.3 % |
| 3.00 | 1.051 | 870 | 0.95 | 10,972 | −11.6 % |
| 3.50 | 0.900 | 910 | 1.11 | 9,828 | −10.4 % |
| 4.00 | 0.788 | 1000 | 1.27 | 9,456 | −3.8 % |
| 4.50 | 0.700 | 1110 | 1.43 | 9,324 | −1.4 % |
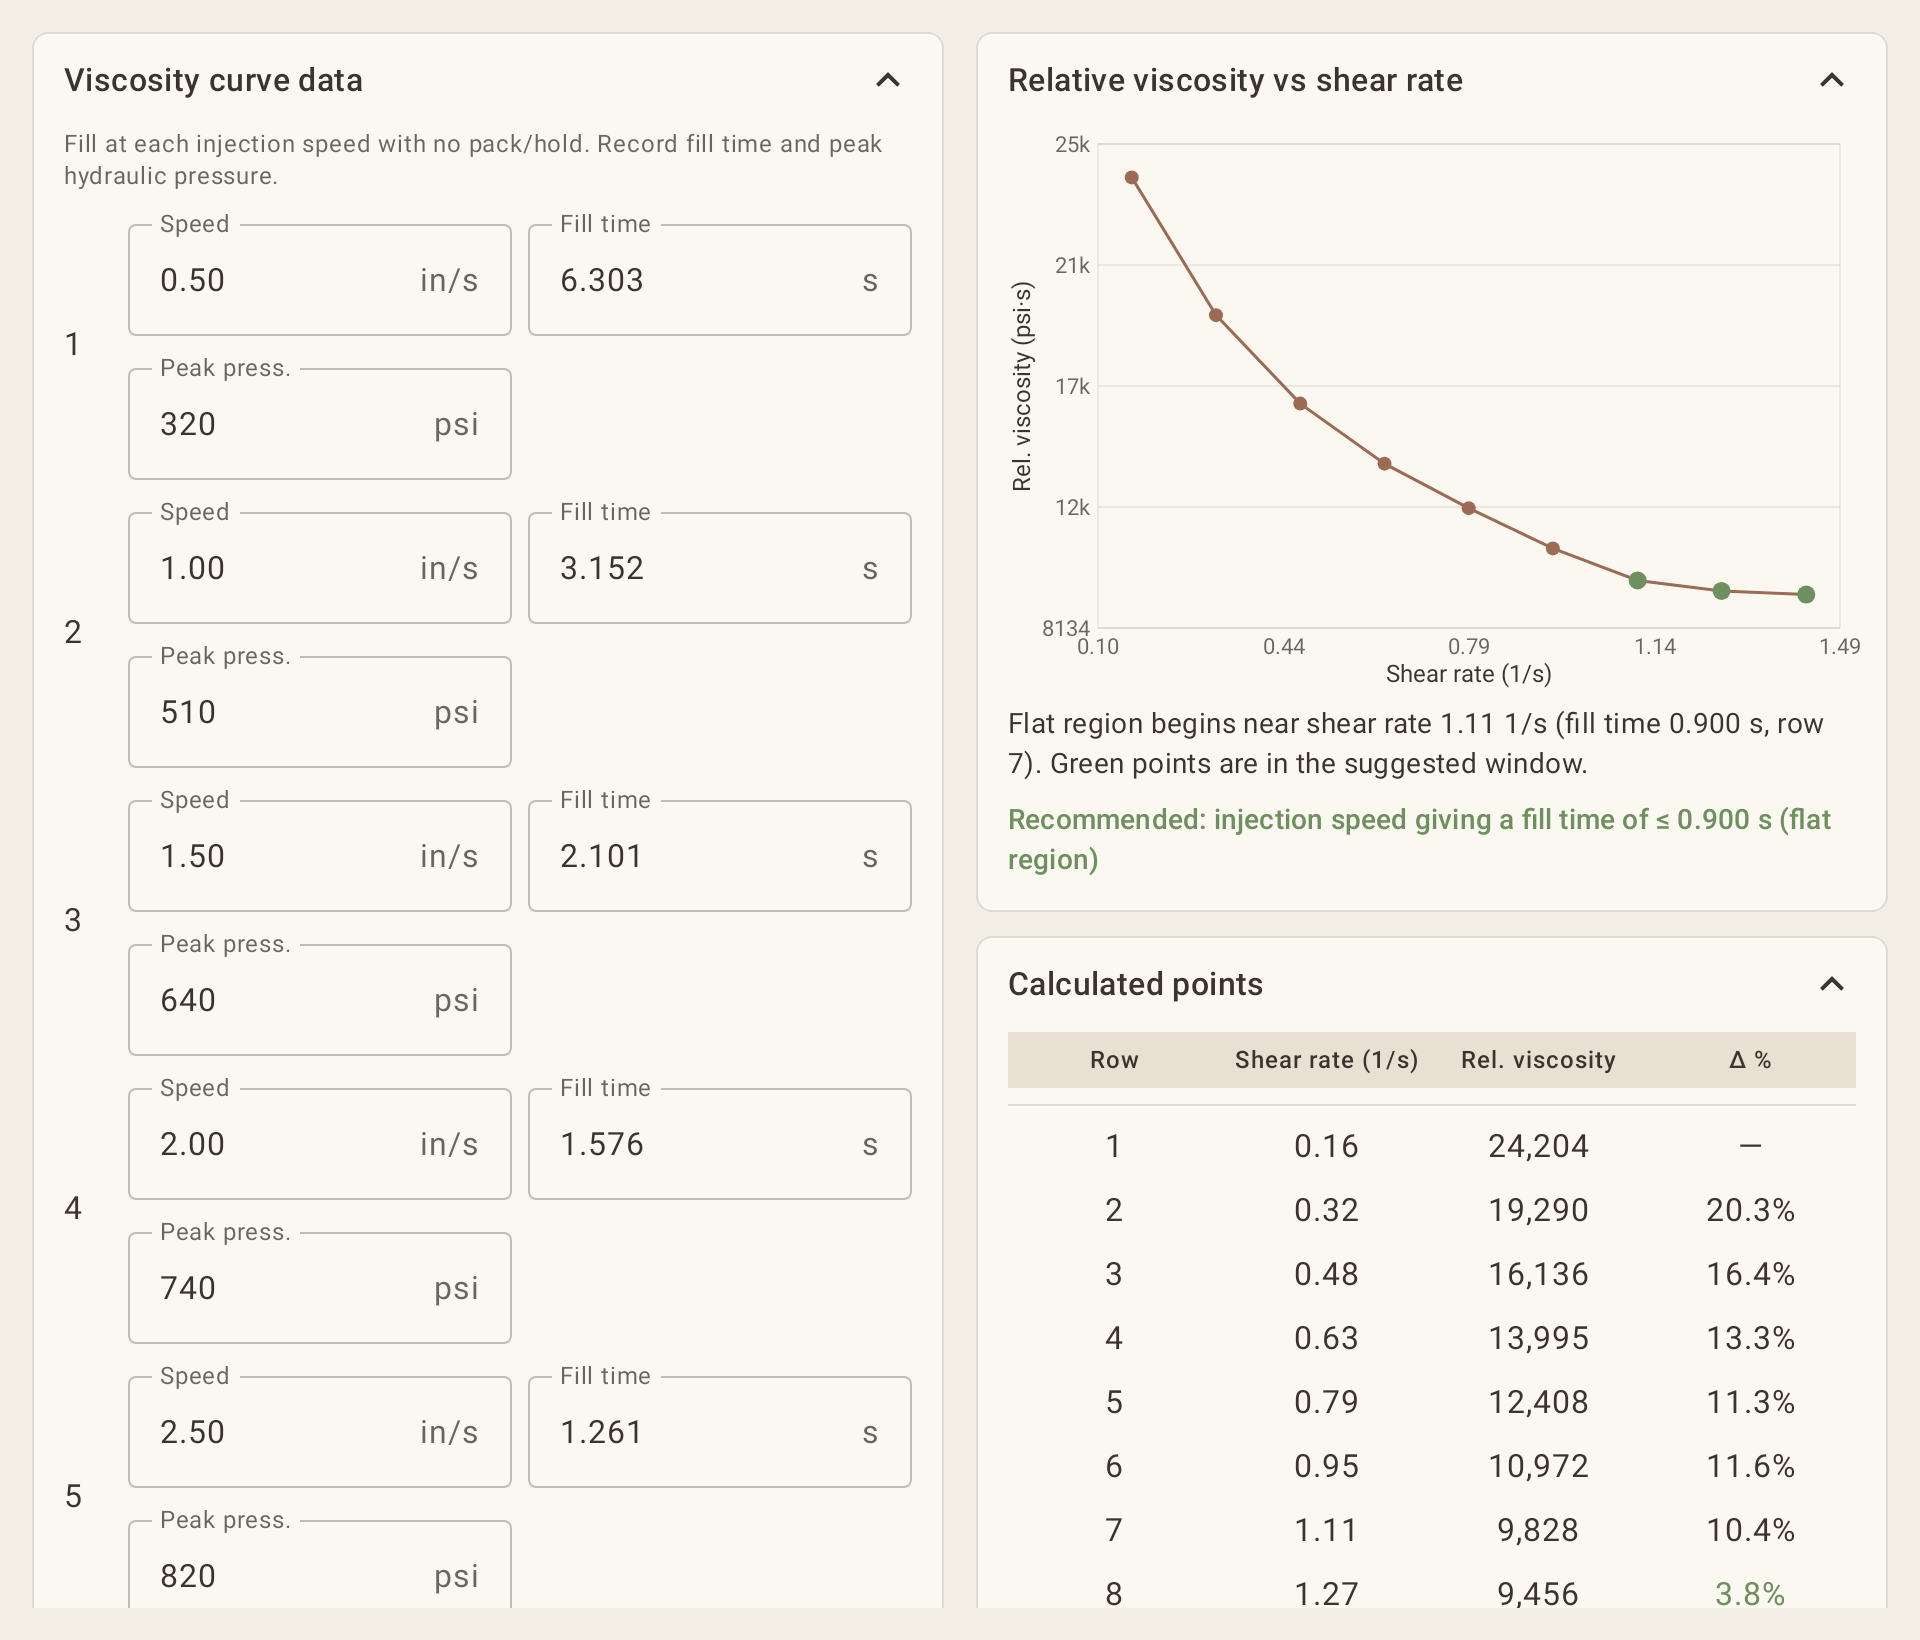
In this sample data, viscosity falls by 10 percent or more at each step up to 3.50 in/s. The first change under 10 percent is from 3.50 to 4.00 in/s (3.8 percent), so IMPD marks the point before it as the start of the flat region: a shear rate near 1.11 1/s (3.50 in/s, fill time 0.900 s), so IMPD recommends an injection speed that gives a fill time of 0.900 s or less. A processor would then confirm part quality and pressure margin in that region before settling on a fill speed.
Common mistakes
- Running the study with hold pressure on, which mixes pack effects into fill data.
- Recording the first shot after a speed change instead of letting it settle.
- Using hydraulic pressure without the intensification ratio and then comparing it to plastic-pressure numbers from another press.
- Treating the curve as the only criterion and ignoring cosmetic or dimensional defects.
How IMPD supports this
IMPD’s Rheology study takes as many injection speeds as you want (at least two), calculates relative viscosity and shear rate, shows the percent change between steps, and suggests the flat region (under 10 percent change). The result, table, and chart go into the job’s PDF report along with any other studies you select. IMPD records data and runs calculations to support engineering decisions; it does not control the machine.
IMPD is coming soon to Google Play. Sign up on the home page to get one email at launch, plus a free month on a yearly subscription.
Leave a Reply